A Special Report · Research by FMC
The 100 Year Cycle
1929 · 2029. Why the sequence that ended the Roaring Twenties points to the late 2020s, and the signposts that will tell us when.
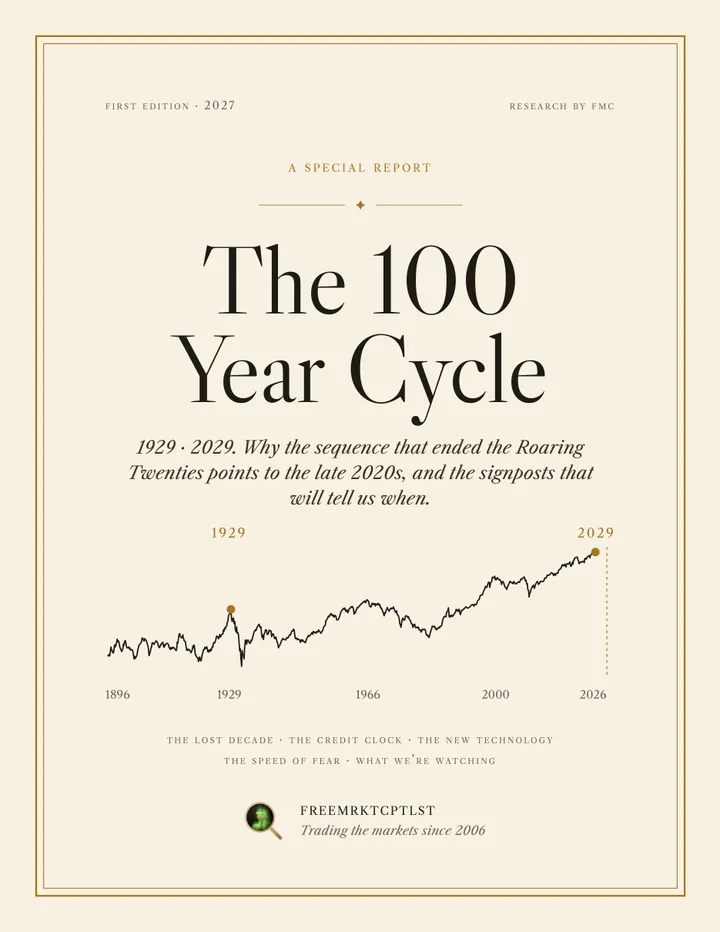
First Edition · 2027
- IPanic of 1907Financial crisis, 2008
- IIFed founded, 1913S&P breakout, 2013
- III1918 flu, 1920–21 slumpCOVID, 2020 recession
- IVRoaring TwentiesAI boom, 2020s
- VOctober 1929The window, if the sequence holds
The idea
Five echoes, a century apart, in the same order. The last is the question.
The report
About 100 pages. One sequence, a century apart.
Ten chapters in five parts, and 21 charts rebuilt from data.

Chapter openers body pages charts the signposts
Skip ahead ↓The idea in brief
The same sequence, a century apart.
Not the same chart. The same order of events: a panic, a new rulebook, a pandemic and a sharp, short slump, then a boom built on a new technology.
The famous “1929 chart” laid one decade’s prices over another, and it failed. Month to month, the Dow of 1900–1926 and the Dow of 2000–2026 have nothing to do with each other.
What lines up is the sequence. Each event of the 1900s has an echo in the 2000s, about a hundred years later, and in the same order. The first four have already happened.
If the sequence holds, it points to a window in the late 2020s. A window is a range, not a date. So the report ends with five signposts to watch, and the readings that would tell us the turn is arriving.
It’s an analog, not a forecast.
Not a prediction. A checklist.
- I1907 · 2008
A panic
The Panic of 1907; the financial crisis of 2008.
- II1913 · 2013
A new rulebook, a new run
The Fed is founded; a century on, the S&P breaks out.
- III1918 · 2020
A pandemic, then a slump
The 1918 flu and the 1920–21 slump; COVID and the 2020 recession.
- IV1920s · 2020s
A boom on new technology
The Roaring Twenties had radio. The 2020s have AI.
- ?1929 · ?
The last echo is the question
October 1929 ended the sequence once. The signposts tell us whether it is ending again.
Years, give or take two, between each pair of echoes.
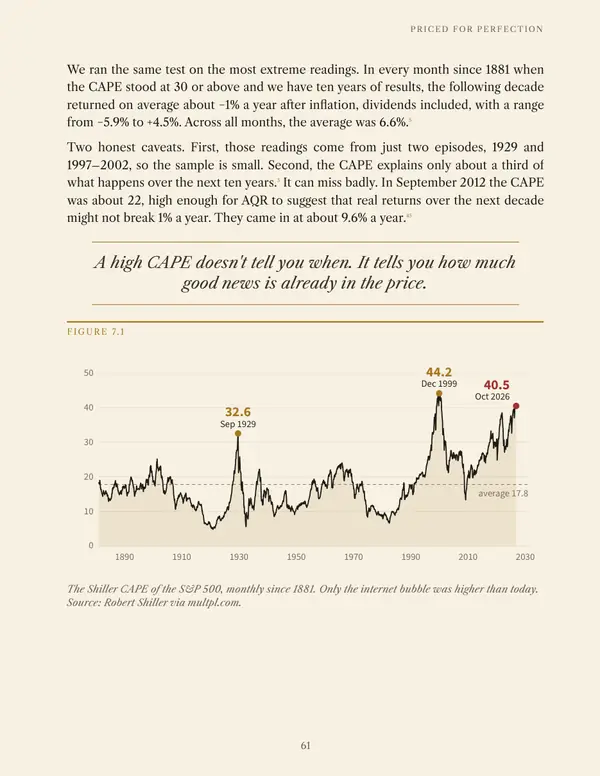
The Shiller CAPE of the S&P 500, October 2026. In September 1929 it was 32.6.
Trading days to fall 30% from the record in 2020. In 1929 it took 31.
What the market costs, 1885–2026
Shiller CAPE, monthly Average since 1881: 17.8
Echoes, a century apart
One turn, year against year.
Set the 1900s and the 2000s on one wheel, so each year of the 1900s sits beside the same year of the 2000s. Each event of the first century lands next to its echo in the second. The spokes lean a little where the timing slips.
Inner ring: the Dow, 1900–1934. Outer ring: 2000 to October 2026. Each on its own log scale; shaded arcs are US recessions. The gold arc is the window, if the sequence holds.
Every great market top arrived with a new technology. 1929 had radio. 2000 had the internet.
The timing is not exact. Give or take two years, each pair sits a century apart; the Panic of 1907 and the crisis of 2008 are 101 years apart, the 1918 flu and COVID 102. It is the order that repeats, not the date. Chapter Two walks through each echo, and where the timing slips.
The last echo is the question.
The report sets out the evidence, the window, and the five signposts that will tell us whether the sequence is holding. Get one email when it’s released.
Inside the report
Ten chapters. One number each.
Each chapter opens on the figure it turns on. Open any chapter to see what’s in it.
Part One · The Sequence
OneAn Analog, Not an Overlay−0.12
The correlation between the Dow of 1900–1926 and 2000–2026, after inflation. Month to month, it is zero.
In this chapter
- The viral 2014 “1929 chart,” and why it failed
- What an analog can tell you, and what it can’t
- Why the sequence is the right frame
- The five pieces of the theory
TwoEchoes a Century Apart100
Years, give or take two, between each pair of echoes. The Panic of 1907 and the crisis of 2008 are 101 apart; the 1918 flu and COVID, 102.
In this chapter
- The Panic of 1907 and the crisis of 2008
- From panic to the Federal Reserve, and from 1913 to the 2013 breakout
- A pandemic, then a sharp, short slump, twice
- The Roaring Twenties and the 2020s
- Where the clock slips
Part Two · The Lost Era
ThreeThe Bubble and the Lost Decade−9.1%
The S&P 500’s total return, with every dividend reinvested, from the end of 1999 to the end of 2009. Ten years, and less money than you started with.
In this chapter
- Two manias seventy years apart: 1929 and 1999
- The lost decade in price, total return and real terms
- Two recessions in eight years
- The echo bubble of 2007, and the new highs that weren’t
Four2008: The Crisis That Reset the Clock−57%
The S&P 500’s fall from its closing high on October 9, 2007 to its closing low on March 9, 2009.
In this chapter
- From subprime loans to Bear Stearns, Lehman and AIG
- Why Bernanke called it the worst financial crisis in history
- The 1907 rhyme: a run, then a new rulebook
- The great deleveraging, 2008 to 2015
Five2013 and the Credit Clock16yrs
The average length of the financial cycle in seven industrial economies since the 1960s, according to BIS research (Borio, 2012). The ordinary business cycle runs 1 to 8 years.
In this chapter
- The March 2013 breakout, and what it ended
- Why bull markets are mostly credit cycles
- The BIS financial cycle, explained simply
- Three great bull markets, and the 2027–2029 window
- Debt moves to Washington, and margin debt comes back
Part Three · The Technology That Changes Everything
SixThe Build-Out$735–750bn
What Amazon, Alphabet, Meta and Microsoft have guided to spend on capital investment in 2026, after their second-quarter calls. In 2025 they spent about $413bn.
In this chapter
- Radio, the automobile and electrification: the 1920s build-out
- Fiber, the internet and the telecom bust
- Carlota Perez on how revolutions get financed
- The AI build-out, in dollars and as a share of the economy
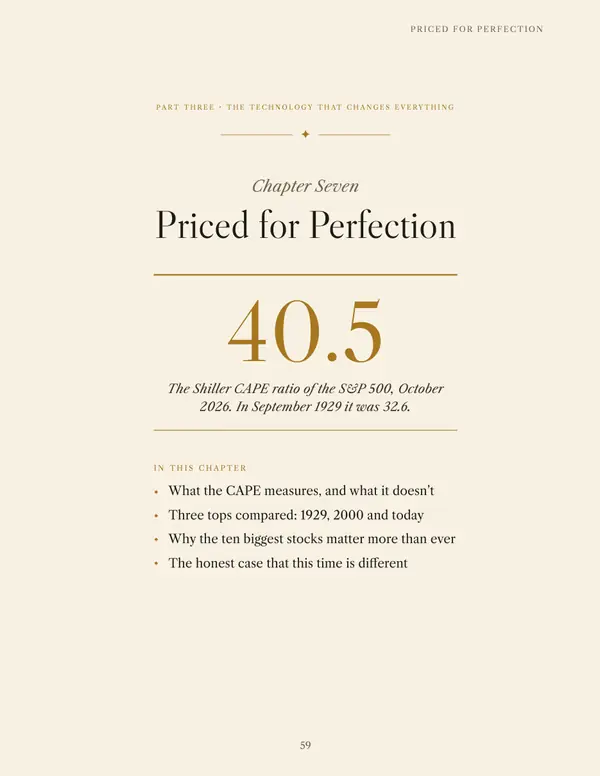
SevenPriced for Perfection40.5
The Shiller CAPE ratio of the S&P 500, October 2026. In September 1929 it was 32.6.
In this chapter
- What the CAPE measures, and what it doesn’t
- Three tops compared: 1929, 2000 and today
- Why the ten biggest stocks matter more than ever
- The honest case that this time is different
Part Four · The Speed of Fear
EightMemetics: The Crash That Wills Itself22days
The trading days the S&P 500 took to fall 30% from its record in 2020, from February 19 to March 20. In 1929 it took 31.
In this chapter
- Every 30% decline since 1896, and why the fastest ones are modern
- From the ticker tape to the group chat: four modern feedback loops
- Reflexivity, narrative economics, and the “1929” story now spreading
Part Five · Honest Accounting
NineWhat Could Make This Wrong8–18yrs
The range of lengths of the great secular bull markets of the past century. A window that wide is a range, not a date.
In this chapter
- Why a cycle is not a clock
- The strongest counter-case: that 1929 has already happened
- Less private leverage, a bigger backstop, and the bias in the mirror
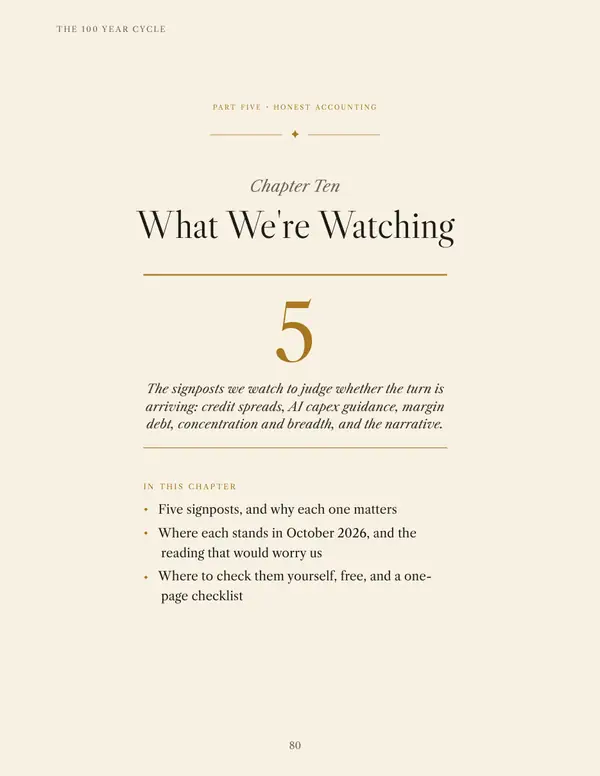
TenWhat We’re Watching5
The signposts we watch to judge whether the turn is arriving: credit spreads, AI capex guidance, margin debt, concentration and breadth, and the narrative.
In this chapter
- Five signposts, and why each one matters
- Where each stands in October 2026, and the reading that would worry us
- Where to check them yourself, free, and a one-page checklist
Real pages from the typeset report
Chapter Seven, Priced for Perfection. Tap a page to enlarge.
Chapter Ten · What we’re watching
The five signposts.
A cycle is not a clock. These are the readings that would tell us whether the turn is arriving, and you can check every one of them yourself.
- I
Credit spreads
The extra yield lenders demand to hold corporate debt instead of Treasuries. When they widen, lenders are growing cautious.
- II
AI capex guidance
What the largest technology companies say they will spend on the build-out. Every great boom is financed; the guidance shows whether the financing holds.
- III
Margin debt
Money borrowed to buy stocks. Leverage builds quietly late in a cycle, and works in both directions.
- IV
Concentration and breadth
How much of the market rests on its biggest stocks, and how many others are still rising with them.
- V
The narrative
The story investors tell about the market, and how fast it spreads, including the “1929” story itself.
For each: where it stands in October 2026, the reading that would worry us, and where to check it yourself, free. With a one-page checklist.

About the author
FMC
FreeMrktCptlst · trading the markets since 2006
The 100 Year Cycle is written by FMC, who has traded the markets since 2006 and publishes as Research by FMC.
FMC is also behind The Market Calendar.

Questions
Before you read.
Is this a prediction?
No. It’s an analog and a checklist. The report shows a sequence of events that has repeated a century apart. If the sequence holds, it points to a window in the late 2020s, and the five signposts are how we judge whether it is holding. A window is a range, not a date.
What format is it?
A PDF report, US Letter, about 100 pages: 10 chapters in five parts, 21 charts rebuilt from data, and an appendix of sources.
When is it out?
The report is planned for release in June 2027. Sign up above and we’ll email you when it’s out.
What will I get?
One email, at launch. The report itself is paid, and its price will be announced at launch.
Do I get updates?
Yes. Future updated editions, the 2028 Update and the 2029 Edition, are free to everyone who buys the report.
Is this investment advice?
No. The 100 Year Cycle is research and history. It is not investment advice, and it is not a recommendation to buy or sell anything.
Planned for June 2027
Be the first to know.
The 100 Year Cycle is not out yet. Leave your email and we’ll write once, on the day it’s released.